 --
--
A crude straight line pushed through the data may have its uses but it can also mask important changes
Below is such a graph
But the graph below shows that a straight line misses a lot of detail
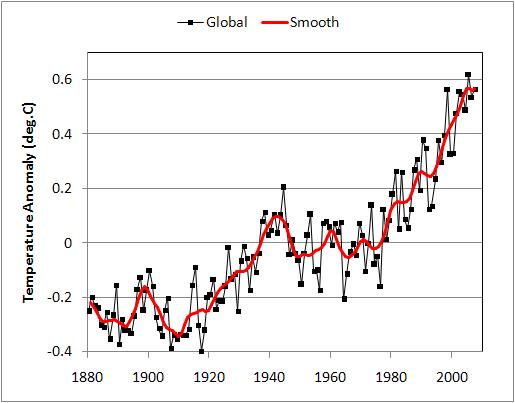
The second graph, for instance shows rather clearly the big global warming hiatus of 1945 to 1975.
Warmists however usually ignore all those "bumps" in the second graph and speak as if the straight line was all that happened.
But even in the period covered by the first graph there is something that makes that graph largely invalid as a representation of recent temperature changes.
There are two researchers (Lindzen and McKitrick) who at different times used radiosonde (balloon) temperature data, which goes back to 1965, well before the satellite data that Carl Mears has just "adjusted". Note that the UAH version of the satellite temperature rise closely parallels the radiosonde data. The Mears adjusted satellite record does not. So the UAH satellite data and the radiosonde data validate one another. (John 8:17) The radiosonde data is therefore strong data that must be accounted for.
And the researchers concerned (Lindzen and McKitrick) initially found that the radiosonde data gave a graph akin to the first one above, a steadily rising line. But when they looked more closely at their data they found something interesting.
There was not a smooth temperature rise at all. The data divided into two essentially horizontal lines separated from one another by a step change in 1976/1977. Temperatures rose abruptly in 1976 by about .25C for no obvious reason -- and then flattened out again. That is of course totally inconsistent from the pattern of steady temperature rise that should have happened according to global warming theory. Carl Mears would no doubt be able to "adjust" that out of existence but the unadjusted data is surely what interests us.
The first such paper was from Richard Lindzen in 2002. Abstract below:
Reconciling observations of global temperature change
Richard S. Lindzen and Constantine Giannitsis
Abstract
It is suggested that the much publicized discrepancy between observed surface global mean temperature and global mean atmospheric temperature from 1979 to the present may be due to the fact that the atmosphere underwent a jump in temperature in 1976 (before the satellite temperature series began), and that the surface response was delayed for about a decade due to the ocean heat capacity. The ocean delay depends on both climate sensitivity and vertical heat transport within the ocean. It is shown that the observed delay is best simulated when sensitivity to doubling of CO2 is less than about 1C.
The second paper is from 2014 and is from Ross McKitrick.
HAC robust trend comparisons among climate series with possible level shifts
Ross R. McKitrick & Timothy J. Vogelsang
Abstract
Comparisons of trends across climatic data sets are complicated by the presence of serial correlation and possible step-changes in the mean. We build on heteroskedasticity and autocorrelation robust methods, specifically the Vogelsang–Franses (VF) nonparametric testing approach, to allow for a step-change in the mean (level shift) at a known or unknown date. The VF method provides a powerful multivariate trend estimator robust to unknown serial correlation up to but not including unit roots. We show that the critical values change when the level shift occurs at a known or unknown date. We derive an asymptotic approximation that can be used to simulate critical values, and we outline a simple bootstrap procedure that generates valid critical values and p-values. Our application builds on the literature comparing simulated and observed trends in the tropical lower troposphere and mid-troposphere since 1958. The method identifies a shift in observations around 1977, coinciding with the Pacific Climate Shift. Allowing for a level shift causes apparently significant observed trends to become statistically insignificant. Model overestimation of warming is significant whether or not we account for a level shift, although null rejections are much stronger when the level shift is included
So the steady rise beloved of the Warmists is just a poorly informed first approximation that vanishes on closer inspection.
No comments:
Post a Comment
All comments containing Chinese characters will not be published as I do not understand them